Bandradar: HF propagation map, live
Who hears whom on the HF bands – the last 24 hours of FT8, WSPR and CW against the VOACAP prediction, worldwide or from your own locator. How to read the map · Open compact window
Operating with WSJT-X? The Bandradar alert line sits next to it as a slim window, alerts stations you still need and tells you when a band change pays off – for Windows, Linux and macOS, free.
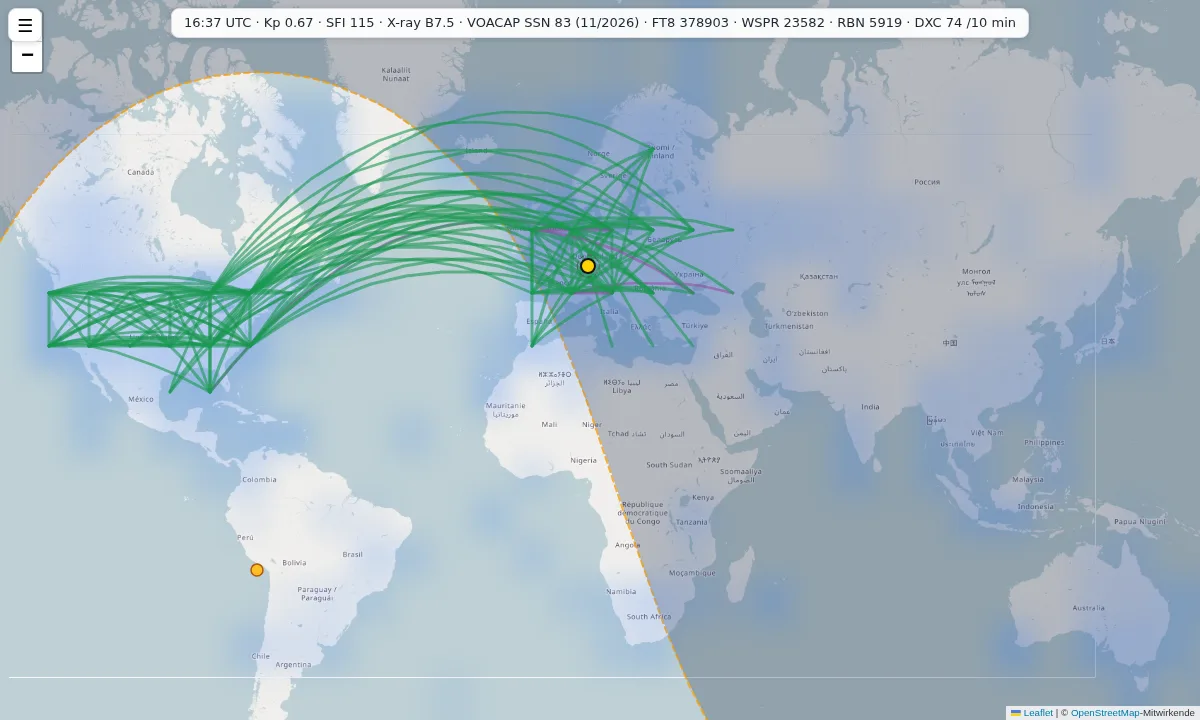
A world map of the last 24 hours: which HF contacts actually happened, in one direction or both, and whether the model predicted them. The data comes from radio amateurs all over the world (FT8, WSPR, CW); the prediction is calculated with VOACAP. For your own location, enter your locator.
What it is for
If you are on the air, you want to know: is the band open right now, and to where? A prediction on its own only tells you what to expect on a median day of the month. The map puts next to it what was actually heard over the last 24 hours. You can see where the model is right, where it is too pessimistic (sporadic E, a solar storm, a night path that has opened) and where a band ought to be open according to the prediction but nobody hears anything.
How to read the map
- World (the same for everyone): the 150 strongest paths between 5° cells, drawn as great circles. Solid = heard both ways, dashed = one way only. Line width = number of spots. Green = heard and predicted, purple = heard but not predicted, grey = no prediction for this path.
- From you: with your locator (default JN49), the Compare, Prediction and Observed views show cells as seen from your location. In Compare, green means predicted and seen, orange predicted but nothing seen, purple seen but not predicted.
- Path: type a target locator or click a cell. The table shows the prediction (colour) and the spots heard (numbers) in both directions for each band and UTC hour.
- Extra layers: MUF (3000 km) and ionosondes from KC2G, D-layer absorption (D-RAP) and the auroral oval from NOAA, day and night.
How the prediction is made
The prediction is calculated by voacapl, the Linux version of the VOACAP propagation model. For every band (80 to 10 m) and every UTC hour it gives the probability REL that the required signal-to-noise ratio is reached, based on the monthly median. The threshold is set for FT8: 13 dB in 1 Hz bandwidth, which is about −21 dB in 2500 Hz. The report shown is the VOACAP SNR minus 34 dB, i.e. the scale WSJT-X displays. The sunspot number is NOAA’s predicted smoothed value for the month (November 2026: 83.2). The model assumes an isotropic antenna (0 dBi), 100 W and a noise level of 145 dBW at 3 MHz. A cell counts as “open” from REL 50 %; you can change that with the slider.
A worked example
Path JN49 (Stuttgart area, Germany) → FN31 (Connecticut, USA): 6,131 km, bearing 295°. The table shows four cells of the path view with the prediction and the WSPR spots of the last 24 hours (as of 13 November 2026, 16:37 UTC; each pair of numbers: sent from JN49 and heard in the FN31 area / sent from there and heard at JN49).
| Band, hour | REL | Report | Spots → / ← | Reading |
|---|---|---|---|---|
| 20 m, 13 UTC | 63 % | −15 dB | 56 / 67 | open and heard both ways: green |
| 15 m, 13 UTC | 72 % | −9 dB | 146 / 73 | open and heard both ways: green |
| 15 m, 12 UTC | 22 % | −36 dB | 201 / 55 | hardly open according to the model, yet clearly heard: purple |
| 40 m, 13 UTC | 0 % | −62 dB | 0 / 0 | closed in daytime: model and observation agree |
The example shows both sides: the model gets the overall pattern right (20 and 15 m open in daytime, 40 m closed). An hour earlier it is clearly wrong on 15 m, because a monthly median knows nothing about the conditions on a particular day.
Alert line for WSJT-X
If you operate with WSJT-X, you can also put Bandradar next to it as a slim window: the Bandradar alert line follows who you hear, alerts stations you still need (new country, new grid, dupes in contest mode) and suggests a band change when another band has more new grids open. For Windows, Linux and macOS; your log stays on your computer.
Limitations
- The prediction is a model, not a measurement. It assumes the monthly median and a standard antenna. A beam or a noisy location will differ considerably. VOACAP only covers 2 to 30 MHz: for 160 m and 6 m the map shows spots only.
- Nothing seen does not mean closed. Often nobody is transmitting or listening there. The more interesting statement is purple: heard although not predicted.
- Grid. The map shows 5° cells (about 550 km at the equator). VOACAP calculates the prediction for each location on 10° cells; for the 5° cells it is averaged between the four nearest calculation points, so the map shows a smoothed pattern rather than a separate calculation per cell. There is no prediction within 400 km of your location. The Reverse Beacon Network and DX clusters give no positions; they are placed at the centre of the call sign’s country. In 3,469 samples the median error was 267 km, roughly half a cell.
- Your location is treated as a 4-character square plus a 200 km radius. FT8, RBN and DX cluster spots count from the moment you first enter the location; for WSPR the map fetches the last 24 h. No call signs are stored.
- Delay: WSPR data at wspr.live lags about 15 minutes behind.
Privacy in brief
The map loads map tiles directly from OpenStreetMap, so the tile server sees your IP address. Your locator stays in your browser’s storage and is sent to my server with each request. Details: privacy policy, section 12.
Sources
- FT8 spots (real-time stream): PSKReporter, MQTT service
mqtt.pskreporter.info; topic scheme checked live on 13 November 2026 - WSPR spots: wspr.live (queries aggregated, cached)
- CW and RTTY spots: Reverse Beacon Network; DX cluster spots via
the public node
dx.da0bcc.de(DXSpider) - Prediction: voacapl (VOACAP for Linux), sunspot number: NOAA Space Weather Prediction Center
- MUF and ionosondes: prop.kc2g.com (data from GIRO and NOAA); D-RAP and aurora (OVATION): NOAA SWPC
- Call signs and countries: country-files.com (
cty.dat) - Background map: OpenStreetMap contributors (ODbL)
Page last updated: 13 November 2026